Search for Indicators
Consumer Expenditures
Consumer Expenditure Indicators are estimates of the percentage of total expenditures spent on a specific health-related products and services. Click into each indicator to see data by zip code and census tract.
Indicator Gauge Icon Legend
Legend Colors
Red is bad, green is good, blue is not statistically different/neutral.
Compared to Distribution
 the value is in the best half of communities.
 the value is in the 2nd worst quarter of communities.
 the value is in the worst quarter of communities.
Compared to Target
 meets target;
  does not meet target.
Compared to a Single Value
 lower than the comparison value;
 higher than the comparison value;
 not statistically different from comparison value.
Trend

 non-significant change over time;
 significant change over time;
  no change over time.
Compared to Prior Value
 higher than the previous measurement period;
 lower than the previous measurement period;
 no statistically different change from previous measurement period.
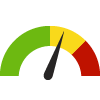
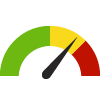
Adult Day Care Spending-to-Income Ratio
Value
Compared to:
Adult Day Care Spending-to-Income Ratio County: Clackamas
Adult Day Care Spending-to-Income Ratio County: Clackamas
10.3%
(2023)
Compared to:
OR Counties
The distribution is based on data from 36 Oregon counties.
U.S. Counties
The distribution is based on data from 3,141 U.S. counties and county equivalents.
OR Value
(11.3%)
The regional value is compared to the Oregon State value.
Prior Value
(10.4%)
Prior Value compares a measured value with the previously measured value. Confidence intervals were not taken into account in determining the direction of the comparison.
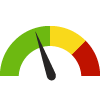
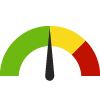
Cigarette Spending-to-Income Ratio
Value
Compared to:
Cigarette Spending-to-Income Ratio County: Clackamas
Cigarette Spending-to-Income Ratio County: Clackamas
1.7%
(2023)
Compared to:

OR Counties
The distribution is based on data from 36 Oregon counties.
U.S. Counties
The distribution is based on data from 3,141 U.S. counties and county equivalents.
OR Value
(1.9%)
The regional value is compared to the Oregon State value.
Prior Value
(1.7%)
Prior Value compares a measured value with the previously measured value. Confidence intervals were not taken into account in determining the direction of the comparison.
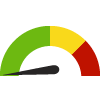
College Tuition Spending-to-Income Ratio
Value
Compared to:
College Tuition Spending-to-Income Ratio County: Clackamas
College Tuition Spending-to-Income Ratio County: Clackamas
11.0%
(2023)
Compared to:
OR Counties
The distribution is based on data from 36 Oregon counties.
U.S. Counties
The distribution is based on data from 3,141 U.S. counties and county equivalents.
OR Value
(12.4%)
The regional value is compared to the Oregon State value.
Prior Value
(11.1%)
Prior Value compares a measured value with the previously measured value. Confidence intervals were not taken into account in determining the direction of the comparison.
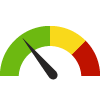
Community Spending on Education
Value
Compared to:
Community Spending on Education County: Clackamas
Community Spending on Education County: Clackamas
2.5%
(2023)
Compared to:

OR Value
(2.5%)
The regional value is compared to the Oregon State value.
US Value
(2.4%)
The regional value is compared to the national value.
Prior Value
(2.5%)
Prior Value compares a measured value with the previously measured value. Confidence intervals were not taken into account in determining the direction of the comparison.
Community Spending on Food
Value
Compared to:
Community Spending on Food County: Clackamas
Community Spending on Food County: Clackamas
12.7%
(2023)
Compared to:

OR Value
(13.0%)
The regional value is compared to the Oregon State value.
US Value
(12.6%)
The regional value is compared to the national value.
Prior Value
(12.7%)
Prior Value compares a measured value with the previously measured value. Confidence intervals were not taken into account in determining the direction of the comparison.
Community Spending on Health Care
Value
Compared to:
Community Spending on Health Care County: Clackamas
Community Spending on Health Care County: Clackamas
7.8%
(2023)
Compared to:

OR Value
(7.9%)
The regional value is compared to the Oregon State value.
US Value
(8.0%)
The regional value is compared to the national value.
Prior Value
(7.9%)
Prior Value compares a measured value with the previously measured value. Confidence intervals were not taken into account in determining the direction of the comparison.
Community Spending on Housing
Value
Compared to:
Community Spending on Housing County: Clackamas
Community Spending on Housing County: Clackamas
32.2%
(2023)
Compared to:
OR Value
(32.9%)
The regional value is compared to the Oregon State value.
US Value
(32.1%)
The regional value is compared to the national value.
Prior Value
(32.2%)
Prior Value compares a measured value with the previously measured value. Confidence intervals were not taken into account in determining the direction of the comparison.
Community Spending on Transportation
Value
Compared to:
Community Spending on Transportation County: Clackamas
Community Spending on Transportation County: Clackamas
15.8%
(2023)
Compared to:
OR Value
(16.0%)
The regional value is compared to the Oregon State value.
US Value
(17.4%)
The regional value is compared to the national value.
Prior Value
(15.8%)
Prior Value compares a measured value with the previously measured value. Confidence intervals were not taken into account in determining the direction of the comparison.
Day Care Center and Preschool Spending-to-Income Ratio
Value
Compared to:
Day Care Center and Preschool Spending-to-Income Ratio County: Clackamas
Day Care Center and Preschool Spending-to-Income Ratio County: Clackamas
6.6%
(2023)
Compared to:
OR Counties
The distribution is based on data from 36 Oregon counties.
U.S. Counties
The distribution is based on data from 3,141 U.S. counties and county equivalents.
OR Value
(7.2%)
The regional value is compared to the Oregon State value.
Prior Value
(6.6%)
Prior Value compares a measured value with the previously measured value. Confidence intervals were not taken into account in determining the direction of the comparison.
Gasoline and Other Fuels Spending-to-Income Ratio
Value
Compared to:
Gasoline and Other Fuels Spending-to-Income Ratio County: Clackamas
Gasoline and Other Fuels Spending-to-Income Ratio County: Clackamas
2.9%
(2023)
Compared to:
OR Counties
The distribution is based on data from 36 Oregon counties.
U.S. Counties
The distribution is based on data from 3,141 U.S. counties and county equivalents.
OR Value
(3.2%)
The regional value is compared to the Oregon State value.
Prior Value
(3.0%)
Prior Value compares a measured value with the previously measured value. Confidence intervals were not taken into account in determining the direction of the comparison.
Health Insurance Spending-to-Income Ratio
Value
Compared to:
Health Insurance Spending-to-Income Ratio County: Clackamas
Health Insurance Spending-to-Income Ratio County: Clackamas
5.6%
(2023)
Compared to:
OR Counties
The distribution is based on data from 36 Oregon counties.
U.S. Counties
The distribution is based on data from 3,141 U.S. counties and county equivalents.
OR Value
(6.0%)
The regional value is compared to the Oregon State value.
Prior Value
(5.6%)
Prior Value compares a measured value with the previously measured value. Confidence intervals were not taken into account in determining the direction of the comparison.
Home Child Care Spending-to-Income Ratio
Value
Compared to:
Home Child Care Spending-to-Income Ratio County: Clackamas
Home Child Care Spending-to-Income Ratio County: Clackamas
3.1%
(2023)
Compared to:
OR Counties
The distribution is based on data from 36 Oregon counties.
U.S. Counties
The distribution is based on data from 3,141 U.S. counties and county equivalents.
OR Value
(3.5%)
The regional value is compared to the Oregon State value.
Prior Value
(3.1%)
Prior Value compares a measured value with the previously measured value. Confidence intervals were not taken into account in determining the direction of the comparison.
Home Renter Spending-to-Income Ratio
Value
Compared to:
Home Renter Spending-to-Income Ratio County: Clackamas
Home Renter Spending-to-Income Ratio County: Clackamas
17.3%
(2023)
Compared to:
OR Counties
The distribution is based on data from 36 Oregon counties.
U.S. Counties
The distribution is based on data from 3,141 U.S. counties and county equivalents.
OR Value
(19.6%)
The regional value is compared to the Oregon State value.
Prior Value
(17.4%)
Prior Value compares a measured value with the previously measured value. Confidence intervals were not taken into account in determining the direction of the comparison.
Homeowner Spending-to-Income Ratio
Value
Compared to:
Homeowner Spending-to-Income Ratio County: Clackamas
Homeowner Spending-to-Income Ratio County: Clackamas
14.5%
(2023)
Compared to:
OR Counties
The distribution is based on data from 36 Oregon counties.
U.S. Counties
The distribution is based on data from 3,141 U.S. counties and county equivalents.
OR Value
(15.1%)
The regional value is compared to the Oregon State value.
Prior Value
(14.5%)
Prior Value compares a measured value with the previously measured value. Confidence intervals were not taken into account in determining the direction of the comparison.
Student Loan Spending-to-Income Ratio
Value
Compared to:
Student Loan Spending-to-Income Ratio County: Clackamas
Student Loan Spending-to-Income Ratio County: Clackamas
3.9%
(2023)
Compared to:
OR Counties
The distribution is based on data from 36 Oregon counties.
U.S. Counties
The distribution is based on data from 3,141 U.S. counties and county equivalents.
OR Value
(4.4%)
The regional value is compared to the Oregon State value.
Prior Value
(3.9%)
Prior Value compares a measured value with the previously measured value. Confidence intervals were not taken into account in determining the direction of the comparison.
Utilities Spending-to-Income Ratio
Value
Compared to:
Utilities Spending-to-Income Ratio County: Clackamas
Utilities Spending-to-Income Ratio County: Clackamas
4.9%
(2023)
Compared to:
OR Counties
The distribution is based on data from 36 Oregon counties.
U.S. Counties
The distribution is based on data from 3,141 U.S. counties and county equivalents.
OR Value
(5.5%)
The regional value is compared to the Oregon State value.
Prior Value
(5.0%)
Prior Value compares a measured value with the previously measured value. Confidence intervals were not taken into account in determining the direction of the comparison.
Vocational, Technical, and Other School Tuition Spending-to-Income Ratio
Value
Compared to:
Vocational, Technical, and Other School Tuition Spending-to-Income Ratio County: Clackamas
Vocational, Technical, and Other School Tuition Spending-to-Income Ratio County: Clackamas
1.3%
(2023)
Compared to:
OR Counties
The distribution is based on data from 36 Oregon counties.
U.S. Counties
The distribution is based on data from 3,141 U.S. counties and county equivalents.
OR Value
(1.5%)
The regional value is compared to the Oregon State value.
Prior Value
(1.3%)
Prior Value compares a measured value with the previously measured value. Confidence intervals were not taken into account in determining the direction of the comparison.
