Search for Indicators

Indicators Relevant to COVID Response
Below is a selection of health indicators that Clackamas County residents are most vulnerable to, increasing risk of COVID-19 and it's secondary effects.
Indicator Gauge Icon Legend
Legend Colors
Red is bad, green is good, blue is not statistically different/neutral.
Compared to Distribution
 the value is in the best half of communities.
 the value is in the 2nd worst quarter of communities.
 the value is in the worst quarter of communities.
Compared to Target
 meets target;
  does not meet target.
Compared to a Single Value
 lower than the comparison value;
 higher than the comparison value;
 not statistically different from comparison value.
Trend

 non-significant change over time;
 significant change over time;
  no change over time.
Compared to Prior Value
 higher than the previous measurement period;
 lower than the previous measurement period;
 no statistically different change from previous measurement period.
 Significantly better than the overall value
 Significantly worse than the overall value
 Significantly different than the overall value
 No significant difference with the overall value
 No data on significance available
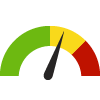
People Living Below Poverty Level
Value
Compared to:
People Living Below Poverty Level County: Clackamas
People Living Below Poverty Level County: Clackamas
7.6%
(2018-2022)
Compared to:
OR Counties
The distribution is based on data from 36 Oregon counties.
U.S. Counties
The distribution is based on data from 3,133 U.S. counties and county equivalents.
OR Value
(11.9%)
The regional value is compared to the Oregon State value.
US Value
(12.5%)
The regional value is compared to the national value.
Trend
This comparison measures the indicator’s values over multiple time periods.<br>The Mann-Kendall Test for Statistical Significance is used to evaluate the trend<br>over 4 to 10 periods of measure, subject to data availability and comparability.
HP 2030 Target
(8.0%)
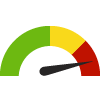
Renters Spending 30% or More of Household Income on Rent
Value
Compared to:
Renters Spending 30% or More of Household Income on Rent County: Clackamas
Renters Spending 30% or More of Household Income on Rent County: Clackamas
53.1%
(2018-2022)
Compared to:


OR Counties
The distribution is based on data from 36 Oregon counties.
U.S. Counties
The distribution is based on data from 3,132 U.S. counties and county equivalents.
OR Value
(50.9%)
The regional value is compared to the Oregon State value.
US Value
(49.9%)
The regional value is compared to the national value.
Trend
This comparison measures the indicator’s values over multiple time periods.<br>The Mann-Kendall Test for Statistical Significance is used to evaluate the trend<br>over 4 to 10 periods of measure, subject to data availability and comparability.
HP 2030 Target
(25.5%)
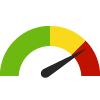
Mortgaged Owners Spending 30% or More of Household Income on Housing
Value
Compared to:
Mortgaged Owners Spending 30% or More of Household Income on Housing County: Clackamas
Mortgaged Owners Spending 30% or More of Household Income on Housing County: Clackamas
31.6%
(2022)
Compared to:

U.S. Counties
The distribution is based on data from 828 U.S. counties and county equivalents.
OR Value
(31.8%)
The regional value is compared to the Oregon State value.
US Value
(27.8%)
The regional value is compared to the national value.
Prior Value
(31.1%)
Prior Value compares a measured value with the previously measured value. Confidence intervals were not taken into account in determining the direction of the comparison.
Trend
This comparison measures the indicator’s values over multiple time periods.<br>The Mann-Kendall Test for Statistical Significance is used to evaluate the trend<br>over 4 to 10 periods of measure, subject to data availability and comparability.
HP 2030 Target
(25.5%)
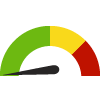
Projected Food Insecurity Rate
Value
Compared to:
Projected Food Insecurity Rate County: Clackamas
Projected Food Insecurity Rate County: Clackamas
9.9%
(2021)
Compared to:
OR Counties
The distribution is based on data from 36 Oregon counties.
U.S. Counties
The distribution is based on data from 3,142 U.S. counties and county equivalents.
OR Value
(12.3%)
The regional value is compared to the Oregon State value.
Prior Value
(14.1%)
Prior Value compares a measured value with the previously measured value. Confidence intervals were not taken into account in determining the direction of the comparison.
Unemployed Workers in Civilian Labor Force
Value
Compared to:
Unemployed Workers in Civilian Labor Force County: Clackamas
Unemployed Workers in Civilian Labor Force County: Clackamas
4.4%
(January 2024)
Compared to:

OR Counties
The distribution is based on data from 36 Oregon counties.
U.S. Counties
The distribution is based on non-seasonally-adjusted data from 3,140 U.S. counties and county equivalents.
OR Value
(4.9%)
The regional value is compared to the Oregon State value.
US Value
(4.1%)
The regional value is compared to the national value.
Prior Value
(3.6%)
Prior Value compares a measured value with the previously measured value. Confidence intervals were not taken into account in determining the direction of the comparison.
Trend
This comparison measures the indicator’s values over multiple time periods.<br>The Mann-Kendall Test for Statistical Significance is used to evaluate the trend<br>over 4 to 10 periods of measure, subject to data availability and comparability.
Households without a Vehicle
Value
Compared to:
Households without a Vehicle County: Clackamas
Households without a Vehicle County: Clackamas
4.9%
(2018-2022)
Compared to:
OR Counties
The distribution is based on data from 36 Oregon counties.
U.S. Counties
The distribution is based on data from 3,133 U.S. counties and county equivalents.
OR Value
(7.0%)
The regional value is compared to the Oregon State value.
US Value
(8.3%)
The regional value is compared to the national value.
Trend
This comparison measures the indicator’s values over multiple time periods.<br>The Mann-Kendall Test for Statistical Significance is used to evaluate the trend<br>over 4 to 10 periods of measure, subject to data availability and comparability.
